
In 2006, 40 producers
from across Ontario tested N rates on their corn fields in order to evaluate
new OMAFRA recommendations compared to more traditional N rates. The results
highlight both the risks and benefits associated with fine-tuning N rates.
Background
40 years of university and government research into corn response to fertilizer
nitrogen has been followed by 4 years of compiling this data and developing
new recommendations. Many growers are aware that these new N recommendations
officially came into play for Ontario corn producers in 2006, and are found
within the Ontario N Calculator for corn. The most recent development in this
ongoing effort to boost profitability and environmental sustainability from
nitrogen use puts these new N recommendations to the test on producers’
fields.
| The
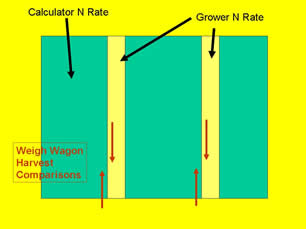
Plan The plan for this project was pretty simple. Use the N Calculator to determine the recommended nitrogen rate for a producer’s specific corn field. Contrast that against what the producer has typically used as an N rate to grow corn. Set up plots and/or sections within the fields to grow corn using both of the aforementioned rates (see Figure 1). Soil texture, soil fertility levels (including soil N tests), GPS site mapping of the field, yields and harvest moistures for each field were obtained over the 2006 growing season. The results allowed us to compare the impact of the various N rates on the yield, the nitrogen costs and the net impact of following the Calculator on each field. |
 |
2006 Results
The results from last year highlighted the potential risks and benefits of fine
tuning nitrogen rates. The risks are most clearly demonstrated by Table 1 where
the expected and actual yields are illustrated.
| TABLE
1. Average N rate recommendations based on grower experience (Grower) and the Ontario N Calculator (Calculator) as well as the expected yield for each site and the actual yields obtained by the two nitrogen rates used. |
|||||
| Provincial Region |
N
Rate (lb N/ac)
|
Corn
Yield (bu/ac)
|
|||
| Grower | Calculator | Expected | Actual Grower | Actual Calculator | |
| South West | 160 | 119 | 148 | 190 | 181 |
| Central | 131 | 93 | 149 | 167 | 163 |
| East | 118 | 90 | 154 | 182 | 180 |
| Average | 134 | 99 | 151 | 179 | 174 |
In putting the Calculator recommendation together, each producer had to enter an expected yield for the field in question. For example, 12 producers in the South West estimated their expected yield to be 148 bu/ac; the Calculator recommendation is aimed at fertilizing for roughly this yield. However, the actual yield from these fields using the grower N rate was a whopping 190 bu/ac. And even where the calculator rate was used (119 lbs N/ac) the average yield was 181 bu/ac. When you sit down in early spring to plan your N requirements for a field, it is virtually impossible to predict when the yield will be 30% greater than the average, but in 2006 that was the outcome. The trend to higher yields persisted right across the province in each area and at virtually all of the 40 sites, as shown in Table 1.
The benefits of sound N recommendations hopefully are not lost as the data is reviewed. Even though on average, the Calculator recommended 35 lbs less N per acre than growers would have typically used, yields on average were only reduced by 5 bushels per acre. And in the final analysis, using the Calculator rate was revenue neutral compared to higher rates (see Table 2). Of course, only the averages are presented here, some growers did actually experience some real penalty for applying the lower rate and some growers experienced some pretty nice gains for not using the higher rate of N they were accustomed to. We will continue to look for specific situations where the new Calculator recommendations seem to miss the mark and look for opportunities to improve the system.
It should be noted that
this project did impose enough different N rates to be able to actually determine
what the “correct” N rate for 2006 should have been on each field.
Its aim was more to invite producers to try the Calculator and use this experience
to assess how they might improve their approach to N management in the future
across all their corn acreage.
| TABLE 2. Average financial impact of using N rates recommended by the Ontario N Calculator as compared to grower rates on 40 farms in 2006. | ||||
|
Region
|
#
of Farm Trials
|
Calculator
Impact on Revenue ($/acre)
|
Calculator
Impact on N Cost Savings ($/acre)
|
Calculator
Net Impact ($/acre)
|
| South West |
12
|
-28.75
|
19.89
|
-8.86
(loss)
|
| Central |
14
|
-14.18
|
17.40
|
3.22
(gain)
|
| East |
14
|
-5.53
|
11.49
|
5.96
(gain)
|
| Average |
40
|
-15.19
|
15.98
|
0.80
(gain)
|
Where
Now?
This project will continue in 2007 with the anticipation that another 40 sites
will put the Ontario N Calculator to the test. Further information regarding
N rates for corn and to see what the Calculator recommends, growers can go to
www.gocorn.net.
Acknowledgements
Appreciation is expressed to the following sponsors of this project: the Ontario
Corn Producers’ Association, the Agricultural Adaptation Council (CORD
IV), AGRICORP, and the Ontario Ministry of Agriculture, Food and Rural Affairs.
Appreciation is expressed to all of the
farm co-operators.